This analysis is to review the factors which impact the performance of the Biathlon Women’s Individual race at the World Cup and Olympic levels of competition. The Women’s Individual race at International Biathlon Union (IBU) Competitions consists of five laps on a 3km racecourse which traverse climbs, descents and undulating/flat terrain. There are four shooting bouts completed in this order: prone, standing, prone, standing; one bout after each of the first four laps. The penalty in the Women’s Individual for a missed shot on target is 60 seconds. This is the largest penalty in any of the race formats in the IBU. The size of this penalty creates a different risk/reward model than in the other race formats. The Women’s Individual is the most traditional format in the IBU competitions. It is much closer to the roots of the way races were held in the earliest days of biathlon.
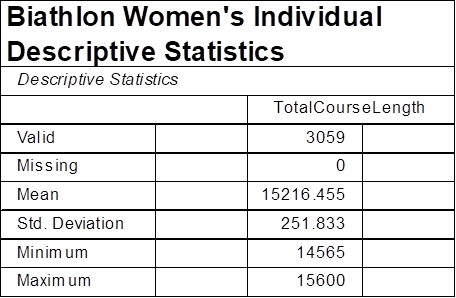
Each course on the IBU Circuit has a different course profile (the location and proportion of each terrain type) and varies in total distance by +/- 4% during the period of the sample, with the minimum course distance during the sample period of 14,565m and the maximum of 15,600mm. All courses must conform to homologation standards defined by the IBU.
The analysis is based on the data interpretation through statistical methods of 3,059 World Cup and Olympic races which occurred between the 2013-2014 and the 2023-2024 Competition Seasons. Data was compiled from results published by the International Biathlon Union which was scraped from various sources and placed in a database which was then cleaned and formatted. Statistical analysis was conducted using JASP 0.19.3.0. The inclusion criteria were athletes who were entered in an Individual competition, though not all these athletes participated in the race.
The analysis will examine the factors which influence the race outcomes in three areas: Environmental Factors, Athlete Factors and Relationships Between Factors.
Environmental Factors
Biathlon is a sport where the environment may have a big influence on the outcome of a race. It is performed outdoors during the winter, on snow, typically in the mountains. Eight environmental factors were considered in this analysis: the Course Distance; the Total Climb of the course; the Maximum Climb of the course; the Weather Type, the Air Temperature, the Snow Temperature and Humidity at the time the race began. The weather-related factors can change during the competition, which may create an advantage based on starting time and position, however in a data set this large, these factors normalize themselves. One potential factor which is not account for is the influence of Wind Speed and Wind Type. Future analysis which includes these factors may reveal interesting relationships. All analysis was conducted using linear or Bayesian regression models, unless otherwise noted, with a p-value of <0.001.
Course Factors
Course Distance
Based on the analysis, the Total Course Length of the race had little impact on the Total Race Time (n=3059) and produced an R2 value of 0.015. The variance in Total Course Length is approximately +/- 4%, so this has a smaller than expected impact.
Total Climb
The analysis showed that Total Climb (the summation of all climbs encountered by the athlete) had little to no impact on the Total Race Time with an R2 value of 0.030. This is most likely due to the nature of the training that is used to prepare athletes for competitions.
Maximum Climb
The Maximum Climb (the largest single climb encountered on the course by the athlete) failed to meet the standard of statistical significance with an R2 value of 0.030. However, when analyzed on an individual athlete basis, it may have a moderate to strong impact on performance.
Combined Course Factors
Based on the analysis of Course Factors with a p-value of <0.001 it can be said that no individual Course Factor directly impacts the Total Race Time to a level of statistical significance. Taken collectively they still fail to meet the standard of statistical significance, but they do begin to have a meaningful impact in explaining the variance in Total Race Time performance with a combined (Course Length, Total Climb, Maximum Climb) R2 value of 0.075.
Weather Factors
Weather Type
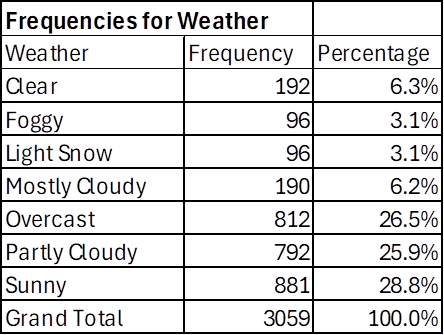
Although there are a wide variety of Weather Types (7) represented in the data, it appears to have little impact on the Total Race Time result with an R2 value of 0.002. This is also a factor that appears to have much greater variance on the individual athlete level.
All the following factors are measured at the time when the first athlete begins the competition:
Air Temperature at Race Start
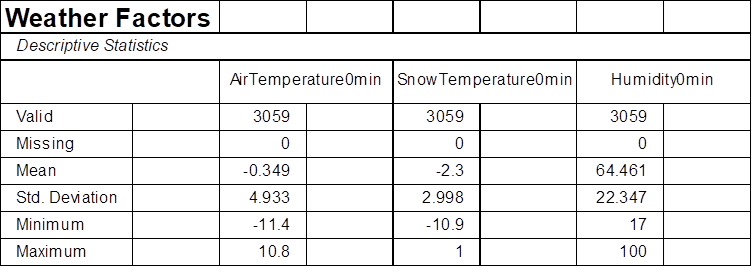
This factor may change (either warming or cooling) throughout the competition time. It appears to have very little impact on Total Race Time with an R2 value of 0.004.
Snow Temperature at Race Start
This factor is slower to change than the Air Temperature, but it is of little consequence to the overall Total Race Time, with an R2 value of 0.002.
Humidity at Race Start
This factor has very little statistical impact on the Total Race Time, but it is a factor with an R2 value of 0.008.
Combined Weather Factors
Based on the analysis of the weather factors with a p-value of <0.001, weather does not appear to directly impact the Total Race Time of the field of athletes in a race. As noted earlier, there are larger variances at the individual athlete level. Taken collectively, we can draw a similar conclusion. Using a Linear Regression Model the combined R2 value of the Weather Type, Air Temperature, Snow Temperature and Humidity at the start of the race is 0.015.
Combined Environmental Model
Using a Bayesian Linear Regression Model we can determine the combined Environmental Factors (Course Length, Total Climb, Maximum Climb, Weather Type, Air Temperature, Snow Temperature and Humidity) has an R2 of 0.091. Although this does not rise to the level of statistical significance, these factors combined explain 9.1% of the variance in Total Race Time. Most of this variance comes from the combination of the Maximum Climb and the Total Climb variables.
Athlete Factors
During competition, it should not be a surprise that athlete performance is the biggest factor in the Total Race Time. In Biathlon there are two key Athlete Factors, Skiing and Shooting, and each of these have sub-factors that directly influence the categorical factors. Because of the different race distances, course profiles and shooting penalties each race type values the skiing and shooting factors differently. These differences should have a direct influence on an athlete’s race strategy and tactics towards the different race types. Theoretically, this would also have a strong influence on the training conducted in preparation for each of these race types.
To clearly quantify the proportion of the race that each category has on the Total Race Time it is important that all the factors are placed on the same scale, time. Many coaches and athletes in Biathlon think about performance on two different scales, time and shooting percentage, which makes direct analysis challenging. All of the penalties that are accrued in a Biathlon race incur a time penalty, whether this is adding 60 seconds to an athlete’s Total Race Time for each missed shot in the Individual Race or requiring the athlete to ski a 150-meter penalty loop, which typically takes 25-30 seconds to complete, in the Sprint, Pursuit and Mass Start races. All these penalties accrue time. Even in races where spare shooting rounds are allowed, the act of manually reloading a single round at a time, accrues a further time penalty. It is for this reason that this analysis and all future race analysis will place the skiing and shooting categories on a common scale to directly compare them and determine each of their relative impacts on the race.
Skiing Factor
In Biathlon the time spent skiing is referred to as Ski Speed. There are numerous ways to quantify this, some of which we will examine, but generally this is defined as the total time spent skiing during the race. This does not account for time spent on the shooting range, in the penalty loop or in transition from the course to the range or the range to the penalty loop. In the Women’s Individual the Total Course Time (the total time spent skiing on the course) has an important impact on the race outcome with an R2 value of 0.591 with a p-value of <0.001. This means that 59% of the variance in the Total Race Time is explained by the Total Course Time variable.
Range Time Factor
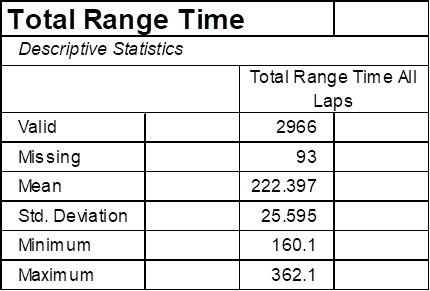
Total Range Time is a summary of the time spent on the shooting range during the four shooting bouts (two prone, two standing) of an Individual race. In the Women’s Individual Total Range Time (the time spent on the firing range) does not rise to the level of statistical significance with a R2 value of 0.013 and a p-value of <0.001.
Total Penalty and Transition Time Factor
Total Penalty and Transition Time Factor accounts for the time that an athlete spends in the area between the end of the shooting range and the beginning of the skiing course. This space is also where the penalty loop is located, and any time spent skiing on the penalty loop is accounted for in this metric. In the Women’s Individual this factor has an R2 value of 0.395 and a p-value of <0.001. Which means that ~40% of the variance in Total Race Time is due to this factor. This is the metric where shooting percentage is accounted for in the model.
Combined Athlete Model
Based on this analysis, the Women’s Individual is an outlier relative to the other race types. Here, shooting factors take on a much higher level of significance. This is almost definitely because the size of the penalty for missed targets is more than 100% higher than in the Sprint, Pursuit and Mass Start. Skiing is still important, determining approximately 59% of the outcome in Total Race Time while the combined shooting metrics (Total Range Time and Total Penalty and Transition Time) determines 40.8% of the Total Race Time. This is the race where fast skiing can not overcome a poor shooting performance.
An Examination of Relationships
When the metrics of the Women’s Individual are analyzed to help understand what the important factors that help determine the race outcome are, some interesting relationships emerge.
A Clear Definition of Ski Speed
When all the data is compiled and analyzed the influence of ski speed on this race becomes clear. Most of the variance in Total Race Time can be explained through Total Course Time with an R2 of 0.591 at a p-value of <0.001. This is a moderate, statistically significant negative relationship. To further build on the importance of skiing ability, the data allows us to create a clear definition of what constitutes “Ski Speed” and how to define and measure it. Total Course Time can be transformed into “Ski Meters per Second” (SMPS) by dividing the distance skied by the time it took. This metric, SMPS, then allows us to create a standardized method to determine how well an athlete is skiing based on a range of expectations that account for other factors (weather, course profile, maximum climb, etc.) This is a way to clearly quantify and standardize this key metric and use it as a tool to understand an athlete’s performance and what can be done to improve it.
The Importance of Ski Meters per Second
With a clear metric, it can then be applied to the component parts of the race and understand the value. In the Women’s Individual, SMPS is important, but not crucial. The data paints a clear picture that SMPS is essential at the beginning of the race. This is somewhat surprising given the much weaker relationship between SMPS and Total Race Time than in other Women’s races. The relationship between a biathlete’s Lap 1 Course Time and their Total Race Time has an R2 value of 0.427 at a p-value of <0.001. What this means is that a biathletes’ ski time on the first lap of the five-lap race, before they enter the shooting range, explains 42% of their Total Race Time. When thought about logically, this makes sense. If an athlete begins a race fast, they will most likely ski fast the entire race. It is unlikely that an athlete will begin a race at a slow or moderate speed and suddenly change their performance part-way through. Of interest, this is a weaker relationship than in the Men’s Individual where the Lap 1 Course Time explains 51% of the Total Race Time. Based on the evidence, SMPS declines on each lap until the last lap, when there is an uptick towards the finish. The SMPS of the Women’s Individual is 2.6% faster than in the Women’s Pursuit, which stands out as something to explore because it is counter intuitive. The Women’s Individual is a longer race with a higher penalty for shooting than the Women’s Pursuit. It would be expected that the SMPS would be slightly slower to account for these two factors, as it is in the Men’s Individual.
Shooting Statistics and Probabilities
Shooting is a key factor in the Women’s Individual. It accounts for 40.8% of the outcome and has a large impact on the results. In the first shooting bout which is done Prone (lying on the ground) the mean shooting percentage is 84.9%. In the second bout, which is done Standing, the mean shooting percentage is 78.6% In the third and fourth bout which are done Prone then Standing respectively, the mean shooting percentages are 85.2% and 78.7%. Whether the first shot is a hit or miss has a large impact on the rest of the shooting sequence. The first shot hit percentages by bout are 83.5%, 77.4%, 85.1%, and 76.4% in Bout order. The probability of hitting all ten targets in Prone is 21.8% and the probability of missing all ten targets is 0.0%. In Standing the probability of hitting all ten targets is 9.7% and the probability of missing all ten is 0.0%. There is a 2.1% probability of shooting 100% in a Women’s Individual race.
If the first shot is a hit in Prone the probability of hitting 4 out of 5 targets in the first bout is 73.8% and 75.1% in the second, where if the first shot is a miss, the probability of hitting 4 out of 5 targets is 8.3% in the first bout and 7.6% in the second. In Standing these percentages are 62.1% and 61.6% for hitting the first shot and 8.5% and 9.1% for missing the first shot respectively by bout.
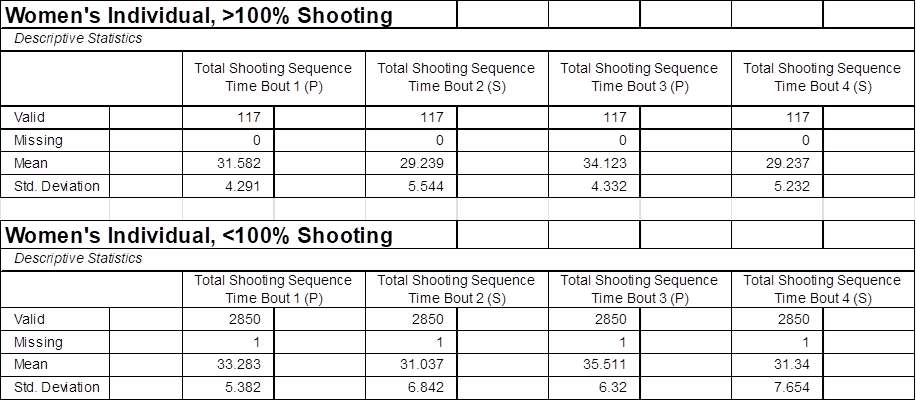
When comparing races where athletes have shot 100% (100P) on all four shooting bouts to those where athletes have shot less than 100% (NOT100P), there are meaningful differences between these groups. The 100P group is 5.4% faster than the NOT100P group in Total Shooting Time, All Bouts.
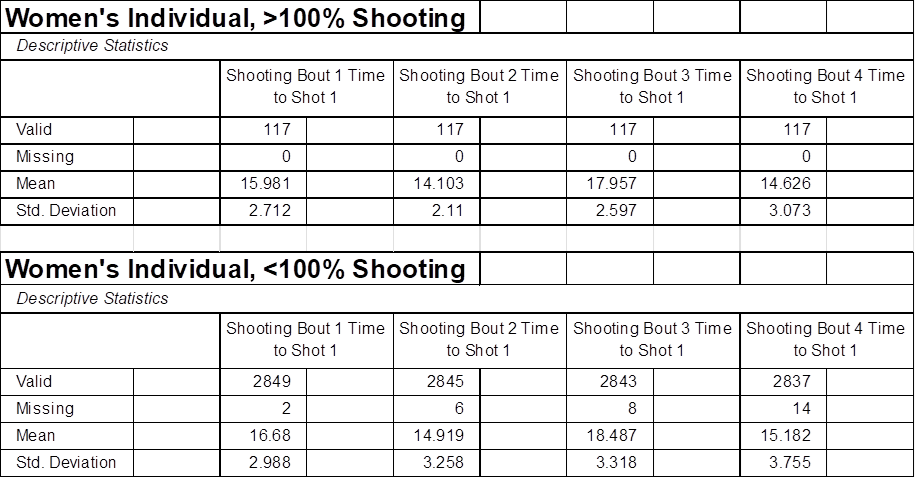
The 100P group was also consistently faster to fire the first shot on each bout over the NOT100P group; 4.2%, 5.5%, 2.9% and 3.7% by bout respectively.
Summary
This analysis yielded some surprises that will need deeper research and analysis to understand. The women’s and men’s Individual race each values shooting significantly higher than the other race formats (Sprint, Pursuit). The Women’s Individual continues to place a higher premium on skiing performance than in the men’s race (59% vs 47%). Additionally, the Athlete Factors explain the entirety of the variance in Total Race Time in the Women’s Individual. This was not the case in the Men’s Individual where Athlete Factors and Environmental Factors combined did not fully explain the variance in Total Race Time. Another minor, but curious detail is that although the Individual is the longest race type, the course related factors (Course Length, Total Climb and Maximum Climb) seem to have the least influence of any of the race types, men or women. This is especially true of the Maximum Climb factor, which has been a measurable distinguishing factor in other race types, but in the Women’s Individual, shows a much smaller impact. Finally, the relationship between an athlete’s Lap 1 Course Time and the Total Race Time was weaker than expected based on earlier race analyses.
In biathlon the Women’s Individual is a unique race. It is the “traditional” race which existed prior to the modern age of biathlon competition. It places a much higher value on shooting performance than either the Sprint or Pursuit. A sixty second penalty for a missed target completely changes the strategy and tactics of the athletes in shooting, the factor with the highest impact is whether an athlete hits the first target on each shooting bout. This has a knock-on effect on the downstream probabilities that affect performance. Shooting 100% in all four bouts has only happened to athletes in 3.8% of all races and has a correlation with a podium performance. Athletes who finished in the top three also achieved 100P 39.7% of the time. Among all athletes who achieved 100P 31.6% of them finished in the top three; with 45.9% in 1st, 27% in 2nd and 27% in 3rd place. The combined probability of shooting 100p and finishing in the top three is 1.2%. Skiing is more important in this race than in the Men’s Individual but shooting has a much higher impact in this race than the Women’s Sprint or Pursuit. The Women’s Individual is a race where a skier may have the opportunity to finish on the podium if they have an excellent day on the shooting range and an average day on the trail.


